Difference between revisions of "RK WINTERCOUNT TIPS"
(→Show/hide whatever form of telemetry data you wish to see in the map) |
(→Switch between various base maps) |
||
| (One intermediate revision by the same user not shown) | |||
| Line 23: | Line 23: | ||
===Switch between various base maps=== | ===Switch between various base maps=== | ||
: You can change your base map any time. | : You can change your base map any time. | ||
| − | : [[File: | + | : [[Main_Page#MAPS|More about remaining map controls here]] |
| + | : [[File:background_maps.jpg|400px]] | ||
===Use the left side Layers/POIs menu to display the shared support datasets=== | ===Use the left side Layers/POIs menu to display the shared support datasets=== | ||
Latest revision as of 14:10, 2 January 2024
ABOUT
- Anitra platform is a flexible environment that allows storing, analyzing, and visualizing telemetry data. On top of actual telemetry data, a lot of additional metainformation and field information or attachments can be stored to document and visualize data in a very rich context. Anitra is primarily tailored to manage even very complex telemetry or other conservation/research projects.
- The functionality includes presentation in maps, flexible data manipulation, and an elaborate data sharing scheme. These features are fit for projects which seek to collaborate in large and heterogeneous teams. Anitra offers ways to share data in a very controlled way - from full to aggregated, simplified, secured, or temporary form.
- The LIFE EUROKITE project team reached out to other data owners and together they make the data of alive tagged Red kites visible temporarily to all the coordinators or even field volunteers of Red kite wintering census events. Anitra platform it the key tool which enables that. The prime intention and focus is to support contributors of the Life Eurokite wintering census but at the same time participants of other censuses such as National or European can benefit the from the datasets and from Anitra functionality at the same time.
- Note the guide below is just a quick overview of few selected features which might be particularly useful for the winter count participants. For browsing the complete platform guide go to Anitra Platform User Guide. For more about Anitra brand refer to our anitracking.com web presentation
These are the tips on how to quickly use the platform to visualise winter count data:
Contents
- 1 Use Anitra „main map“ and data filters below
- 2 Switch between various base maps
- 3 Use the left side Layers/POIs menu to display the shared support datasets
- 4 See the details
- 5 Use the Anitra Last point marks to load the tracks/waypoints in the map
- 6 Show/hide whatever form of telemetry data you wish to see in the map
- 7 Zooming the map
- 8 Combine the tracking and support information available
- 9 Check the situation around Eurokite Red kite roostsites
- 10 Document any additional roost sites using „Create new POI“ functionality
- 11 Add "Roost checks" or "Animal checks" using Add Event functionality
- 12 Check the Anitra help pages for more usage info
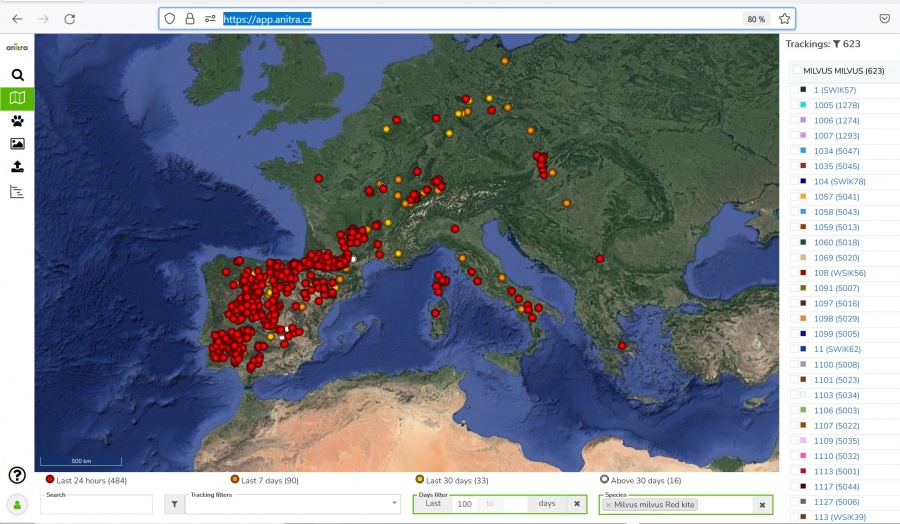
Use Anitra „main map“ and data filters below
- After loading the map shows the last positions of all the tagged birds to which the user has at least visibility rights.
- Filters below the map can be used to refine what you wish to see.
- Note the particular importance of the "Days" filter - it can limit data displayed to X defined days back.
-
Switch between various base maps
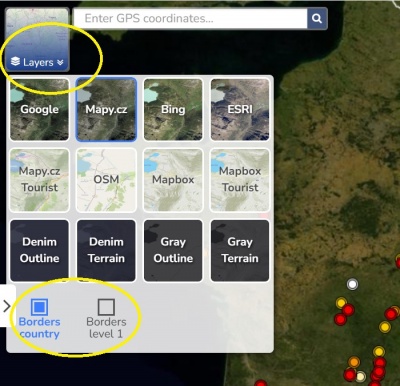
- You can change your base map any time.
- More about remaining map controls here
-
- The left side panel is shown using the marked symbol on the map.
- You can choose any of the layers (POIs = Points of Interest, Events/Observations, or Areas) helping you with the fieldwork.
-
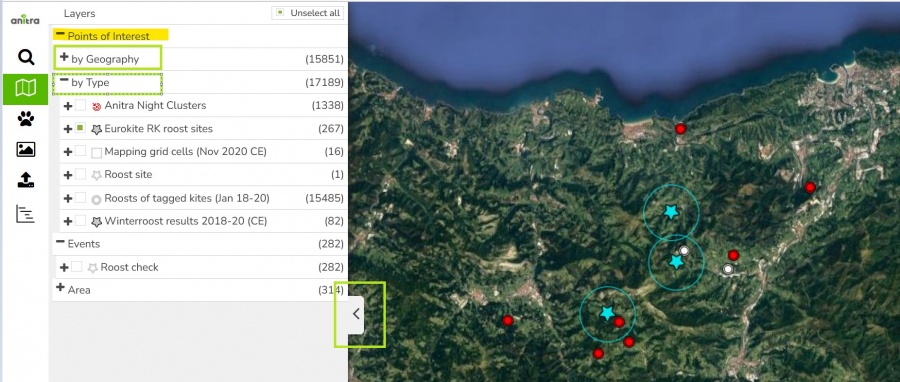
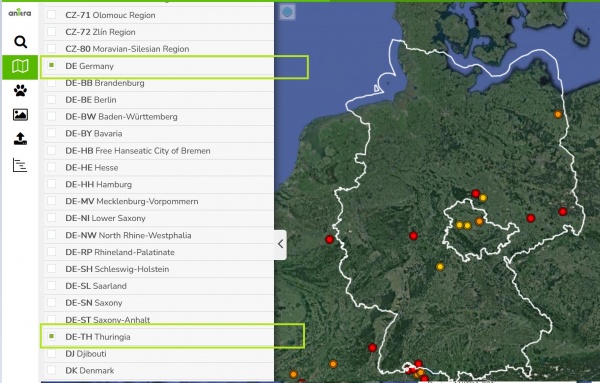
- Manage what is displayed or hidden by selecting the layers at various levels of the drill-down trees available.
-
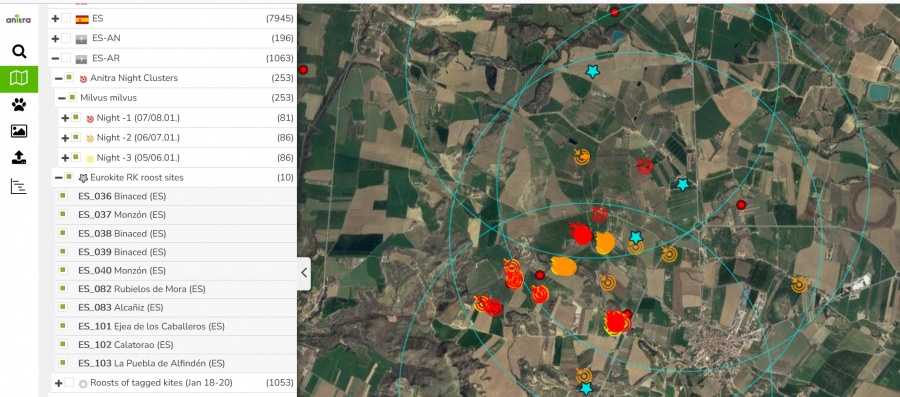
- The "area" tree allows showing borders of your country/territory of interest
-
See the details
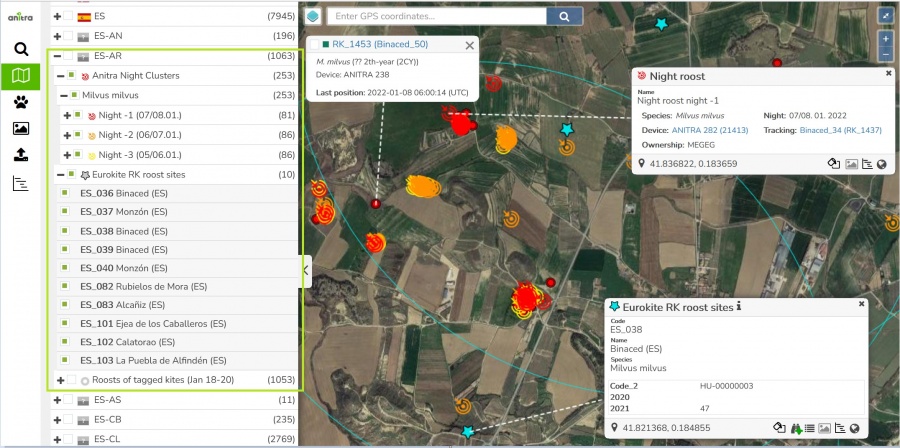
- By hovering the mouse over tracking points or POI/Event icons the related info is shown.
- By left mouse click the info is opened and pined
- By left mouse double-clicking you can open edit mode for editable objects (i.e. POIs or Events created by yourself)
-
Use the Anitra Last point marks to load the tracks/waypoints in the map
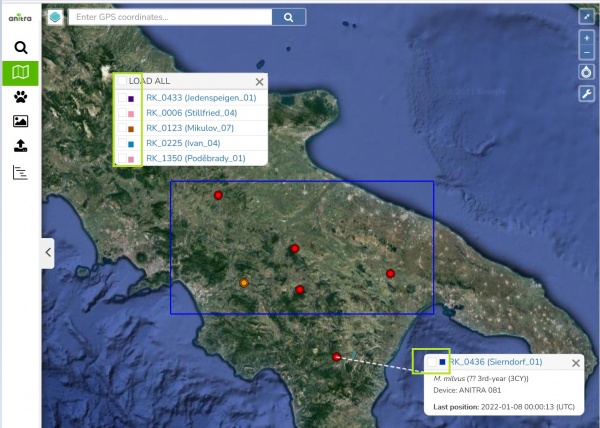
- Click at the last point tooltip or use the rectangle tool (CTRL + dragging by the left mouse button) to select multiple Animals
- Check to load actual tracking data in the map (waypoints and/or tracks).
-
Show/hide whatever form of telemetry data you wish to see in the map
- Understanding and using map options/controls can boost your productivity
- You can thus adjust the data form displayed (i.e. show or hide the last points, day/night/all waypoints, and tracks) so that it helps most in the particular situation.
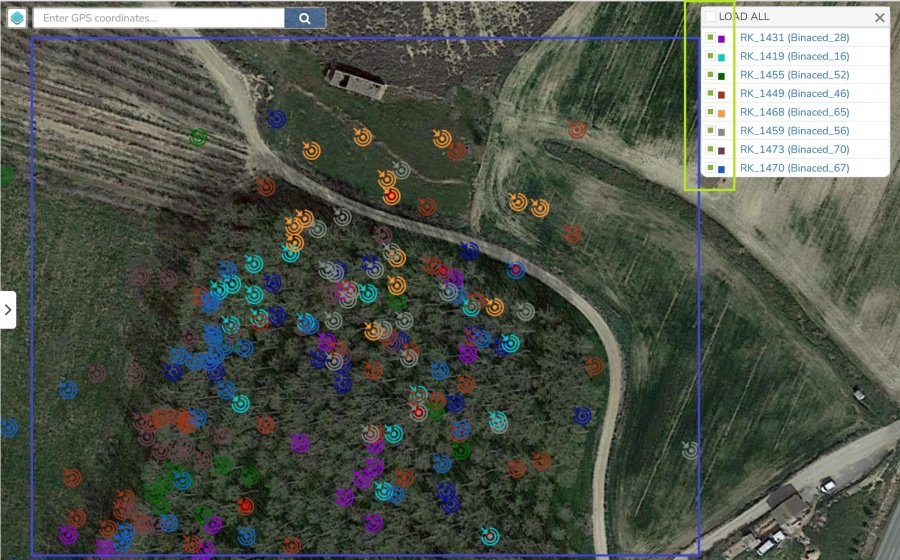
- Analyzing roost sites the following two combinations can give you good quick overview of the situation:
Zooming the map
- Gives full detail of the night positions and even info how many different tagged birds (various colors) used the roost site over the defined time interval
-
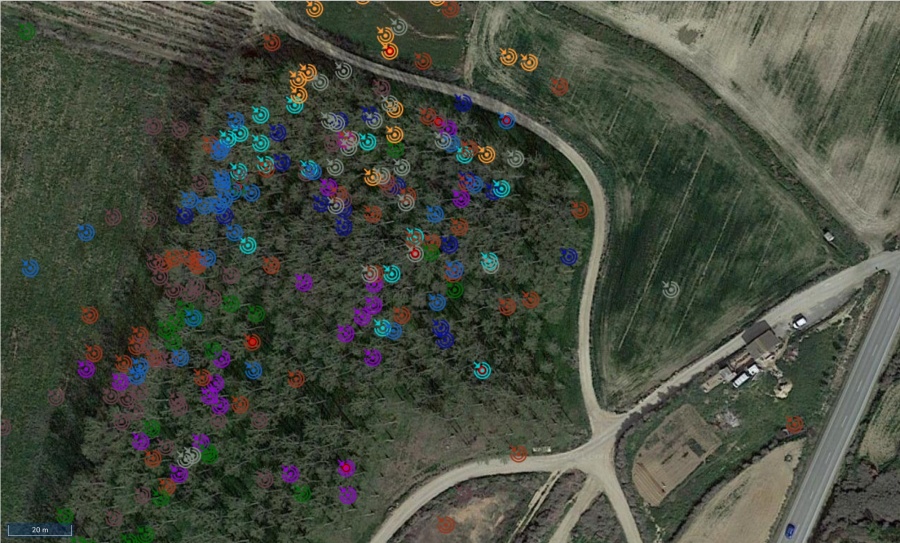
- Note same as while selecting you can unselect all the amimals using e.g. rectangle tool
-
Combine the tracking and support information available
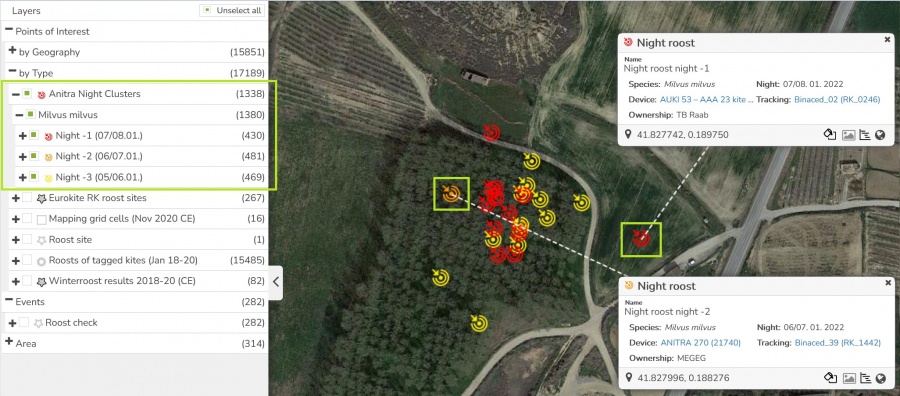
- „Anitra night clusters“ functionality (i.e. dynamicaly clustered 3 nights back) holds the most up to date info on what is the recent location of the night roost
- Browsing this data you can learn some interesting things or spot some possible problems with tracked animals.
-
Check the situation around Eurokite Red kite roostsites
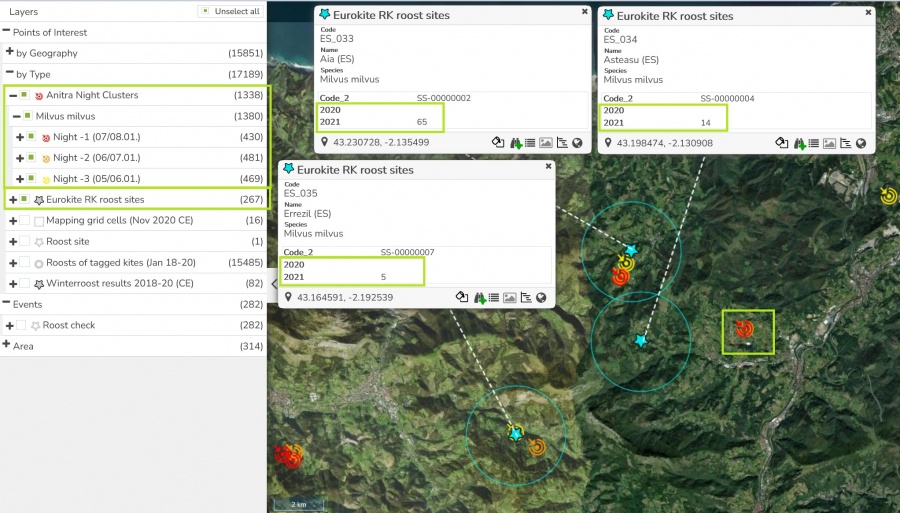
- Display the EUROKITE priority roost sites (cyan star icons with 2 km radius circle) and check the current situation around.
- Note the 2-kilometer circle refers to the agreed guideline of interpreting roosts as the same.
-
Document any additional roost sites using „Create new POI“ functionality
- Any additional roost sites (brand new or additional to Eurokite roostsite list) you can add yourself as a dedicated type of POI (Point of Interest)
- Use the „create new POI“ item from the right-click context dialog over the map
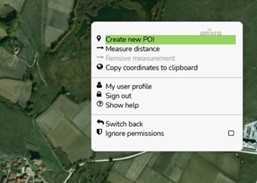
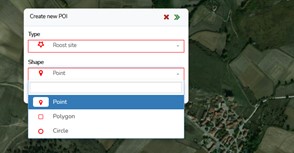
- Set the POI type to „Roost site“ and select the object shape (a „point“ is a default option in this case)
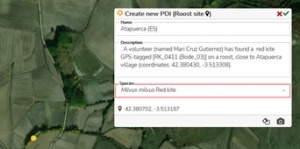
- Enter preferred name for the site, add your comment, specify species and define the location in the map.
- You can also modify the map placemark color using the „Style“ icon.
- Once filled in, confirm the dialog by the green check in the top right corner.
- Use the „create new POI“ item from the right-click context dialog over the map
- Note a new browsing path „Roost site“ will be displayed in the left POI panel

Add "Roost checks" or "Animal checks" using Add Event functionality
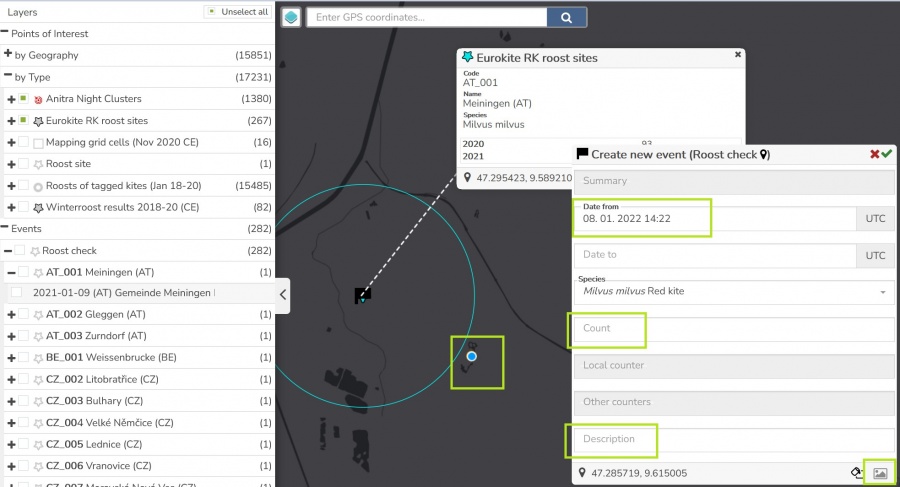
- For each of the POIs (including Roosts sites) you can add your filedcheck (for Roost sites in the form of "Roost check" record).
- Roost check can be added using icon in the parent POI
-
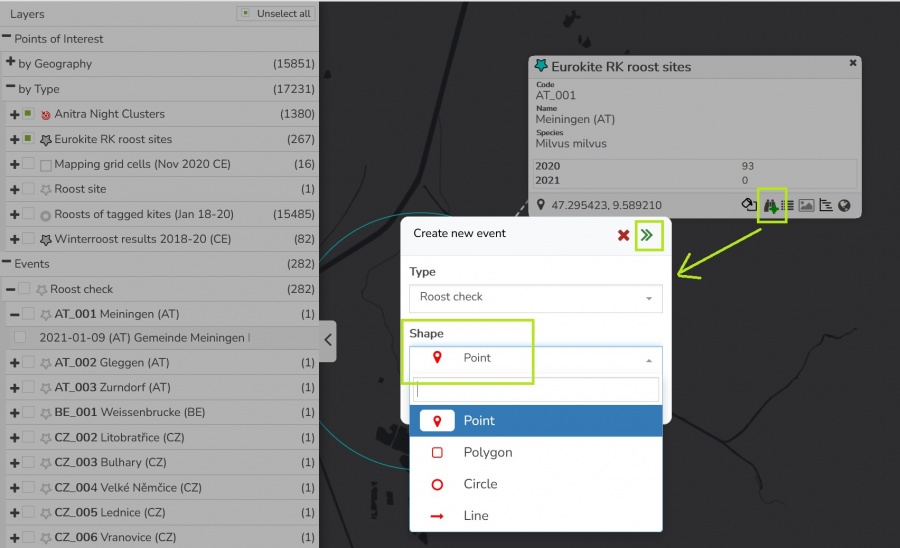
- The record structure contains author (automaticaly assigned), date time, comments, actual location, number of individuals, or photo(s).
-
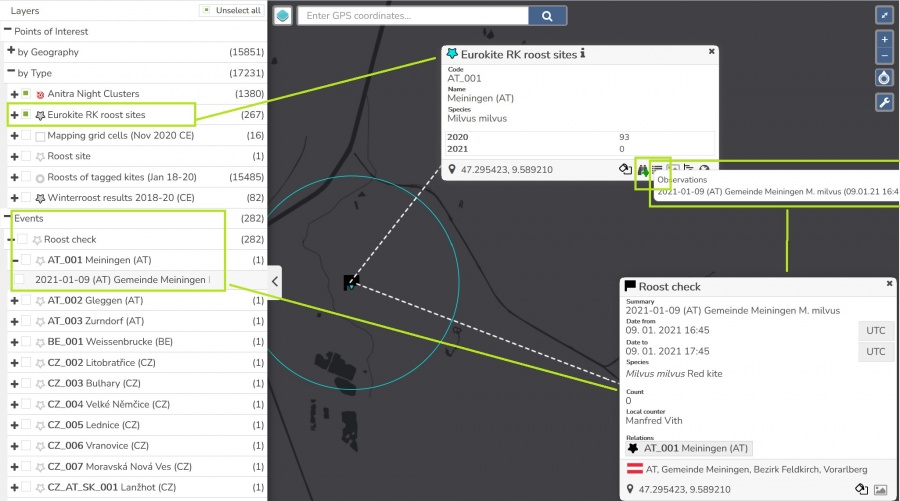
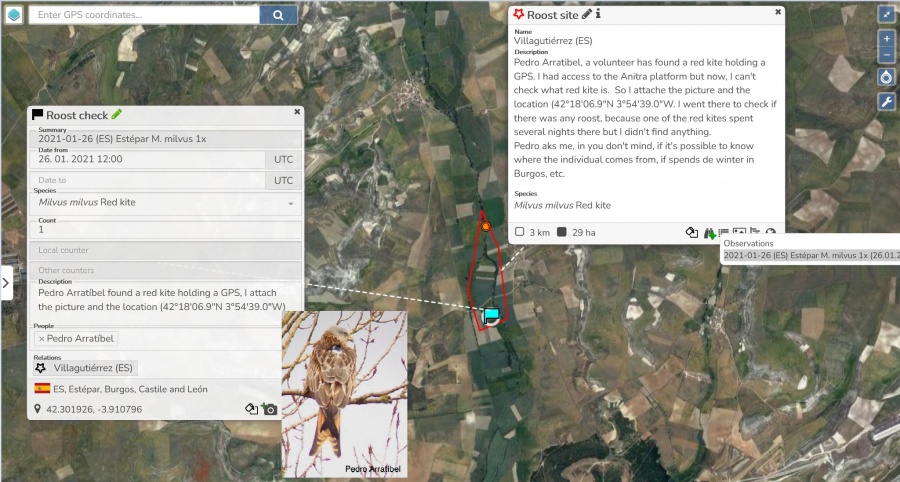
- All the stored Roost checks you can find in the Events tree and also appended in the parent POI history log
-
-
Check the Anitra help pages for more usage info
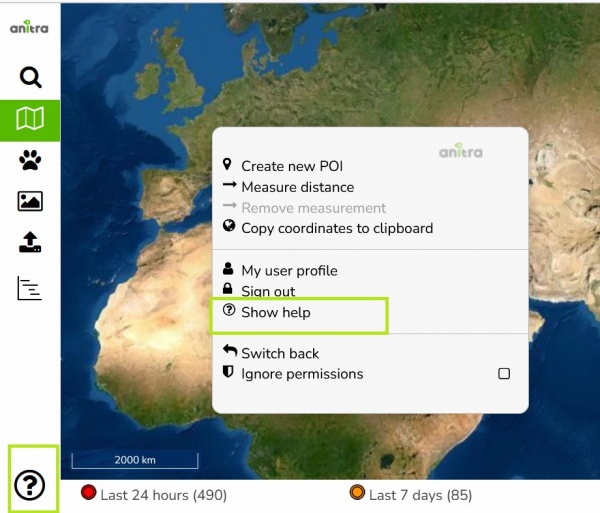
- The help is available under the „question mark“ icon in the left side navigation menu or in the right-click context dialog.
The icon links to our Online user guide: https://anitracking.com/wiki -
